In the Paris Agreement, countries agreed to the global goal of limiting end-of-century global warming increase to well below 2°C and pursue 1.5°C. However, progress to date remains insufficient to minimise the worst impacts of climate change. Countries must commit to more ambitious mitigation targets in their Nationally Determined Contributions (NDCs).
Every five years, the Global Stocktake (GST) analyses global progress and informs Parties in updating and enhancing their actions and support as well as enhancing international cooperation. The information collected during the GST will inform countries’ NDC updates and consequently measures to implement them.
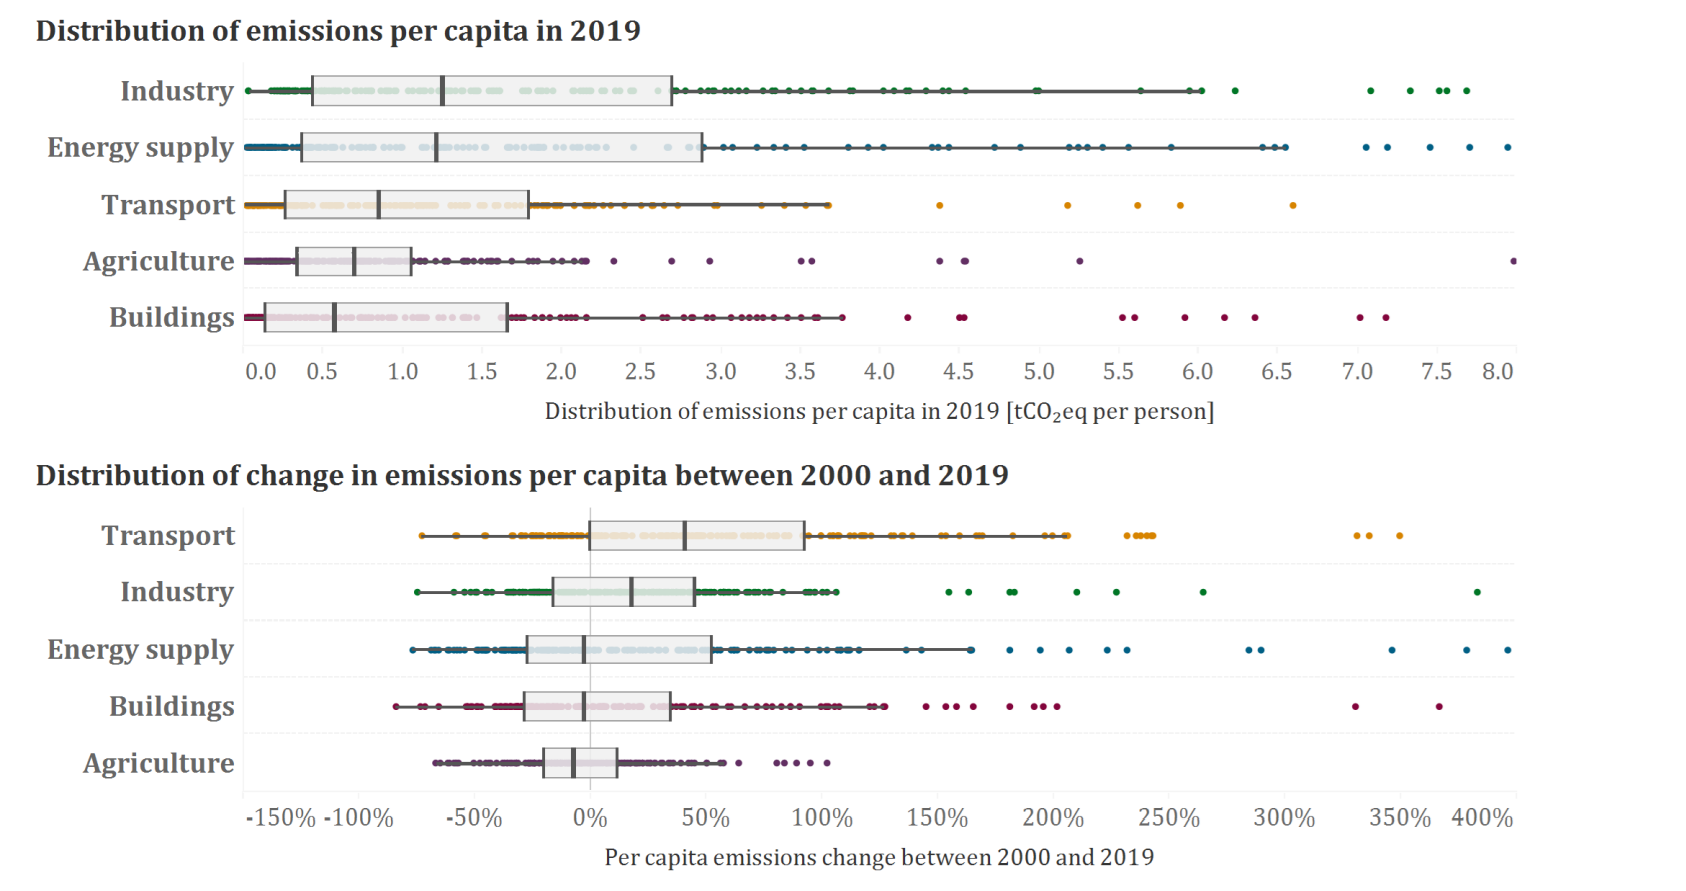
In our analysis, we used performance distributions to analyse trends in sectoral GHG emissions per capita. A performance distribution is a histogram that groups countries based on how they fare on a specific indicator. It also indicates how the indicator is spread across countries, which supports comparisons and assessments of change over time.
Main findings
We find that transport- and industry-related emissions per capita increased in over half of the 180 countries examined in the past twenty years (positive median increase in Figure 1 – bottom). In the transport sector, only one-quarter of the countries have 2019 emissions per capita below 2000 levels, in contrast to slightly over one-third in industry. However, in the energy supply sector, we observe that most countries have 2019 per capita emissions below 2000 levels. In addition to energy supply, building and agriculture emissions per capita are below 2000 levels in over half of the countries studied.
To better understand why these trends are observed, we also examine recent trends in key subsectors, such as electricity and heat, or the metals industry, where similar trends are observed. Emissions per capita have declined in the past five years in over half of the countries in several sub-sectors analysed. In several countries, we observe rates of decline above 10% per year in some industry and energy supply subsectors. Comparing recent trends in subsectors shows the transport sector as a laggard – emissions per capita associated with road transport increased in almost two-thirds of the countries.
More generally we find that:
- In all sectors, several countries had per capita emissions in 2019 below 2000 levels. Reasons for these declines vary, but these countries can provide lessons for others.
- In several subsectors, countries show a recent decline in emissions per capita. However, the development of total emissions observed in recent years is not in line with the temperature goal of the Paris Agreement.
- In some sectors, such as buildings and agriculture, most countries have per capita emissions below 2000 levels. This is encouraging but in order to substantively decrease emissions, profound changes are needed in these sectors.
- In other sectors, such as industry and transport, a rapid change in direction is needed since most countries have per capita emissions above 2000 levels and emissions per capita in subsectors still increase. However, some countries show that such a change in direction is possible.