Climate change results in unprecedented and rapid changes in the Earth’s systems. These changes are expected to reach devastating levels if countries do not reduce their greenhouse gas emissions to zero and collectively limit the end-of-century temperature increase to 1.5 °C. To mitigate climate change, countries adopt and implement several policies. However, policies to date have been insufficient to curb historical global emissions.
In our research, we compared the number of policies in force across country groups to identify means to expand and improve climate policy. First, we evaluated whether the prevalence of policies is associated with lower projected emission change rates between 2021 and 2030. This clarifies that expanding climate policy adoption is desirable to slow down future emissions. Second, we compared the number of policies across country groups to identify areas with substantially fewer policies. This supports identifying means to expand climate policy adoption in line with best-performing countries.
The number of policies in force is associated with projected emissions
We find that countries with more policies have lower projected emissions up to 2030. The total policy density is associated with a lower average emission change rate between 2021 and 2030 (Fig. 1a). These results are robust when controlling for the rule of law, per capita values for historical emissions and GDP, and the number of high-impact policies. Also, although the magnitude of the effect varies across clusters, policy density is associated with lower emissions growth across all clusters (Fig. 1b).
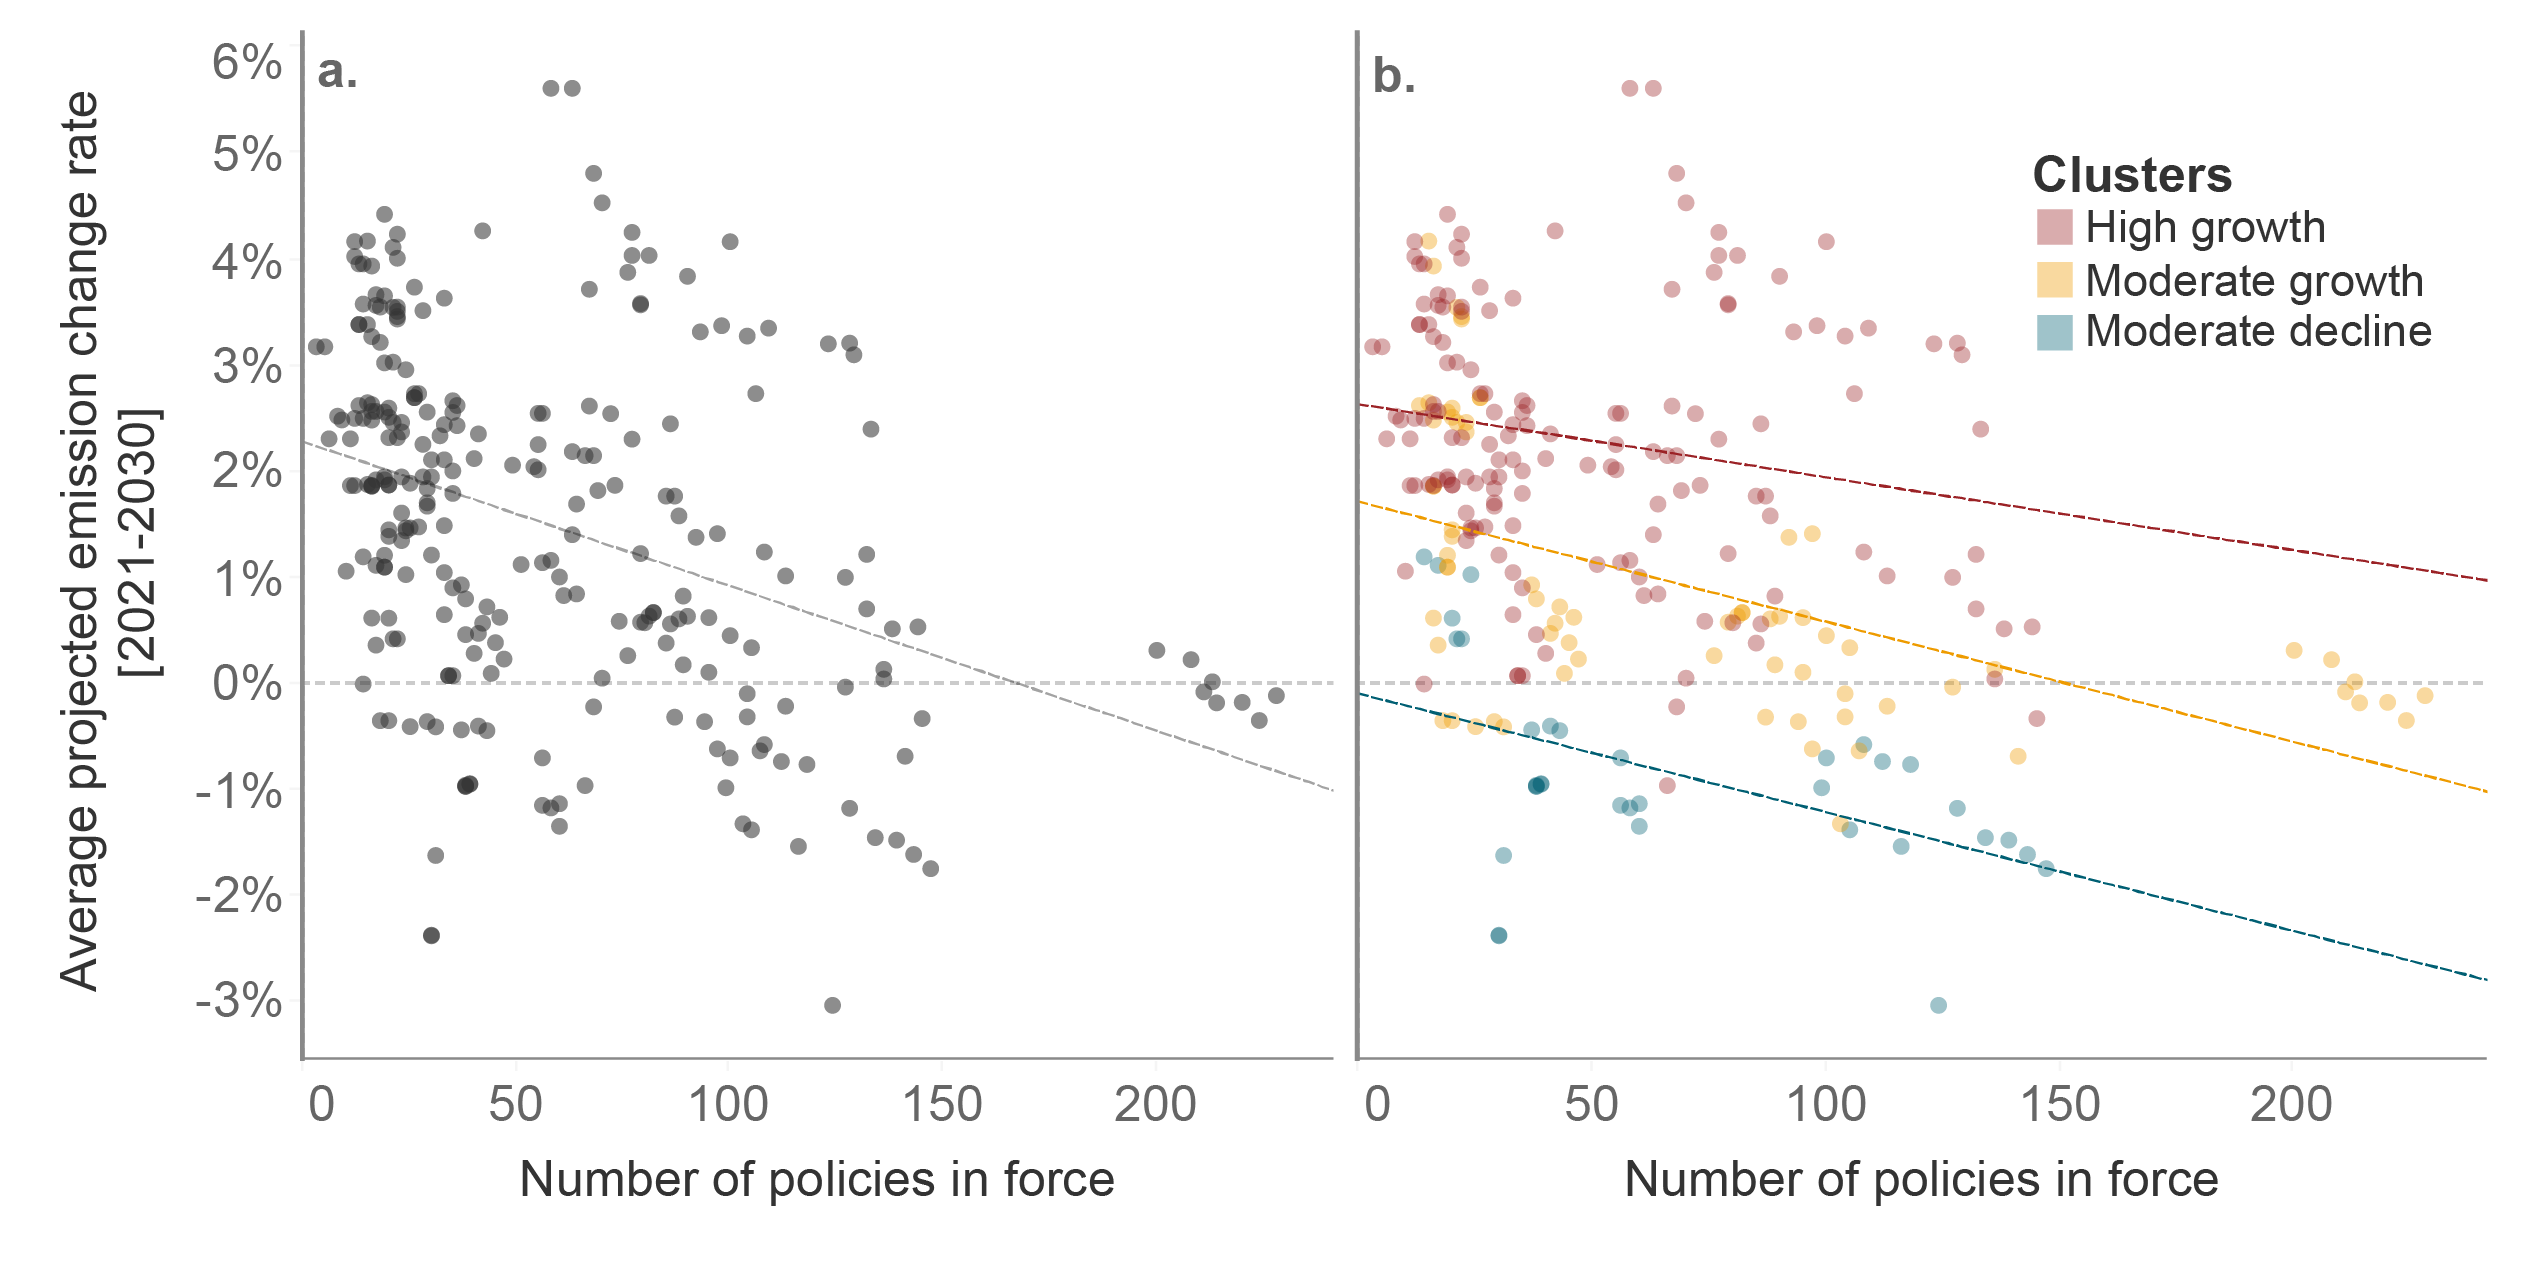
Figure 1: Relationship between average annual projected emission change rates and a number of policies. Countries with more climate policies have lower projected emission change rates (a). This result is valid across clusters although to a different degree (b). Results are statistically significant despite variance.
Entry points to expand climate policy adoption vary across countries
Considering that an increase in the number of policies is associated with lower projected emissions growth, we aim to identify potential entry points to expand policy adoption using countries with a moderate decline in emissions as a reference. We compared policy density in the ‘high growth’ and ‘moderate growth’ clusters to that of the ‘moderate decline’ cluster (Fig. 2).
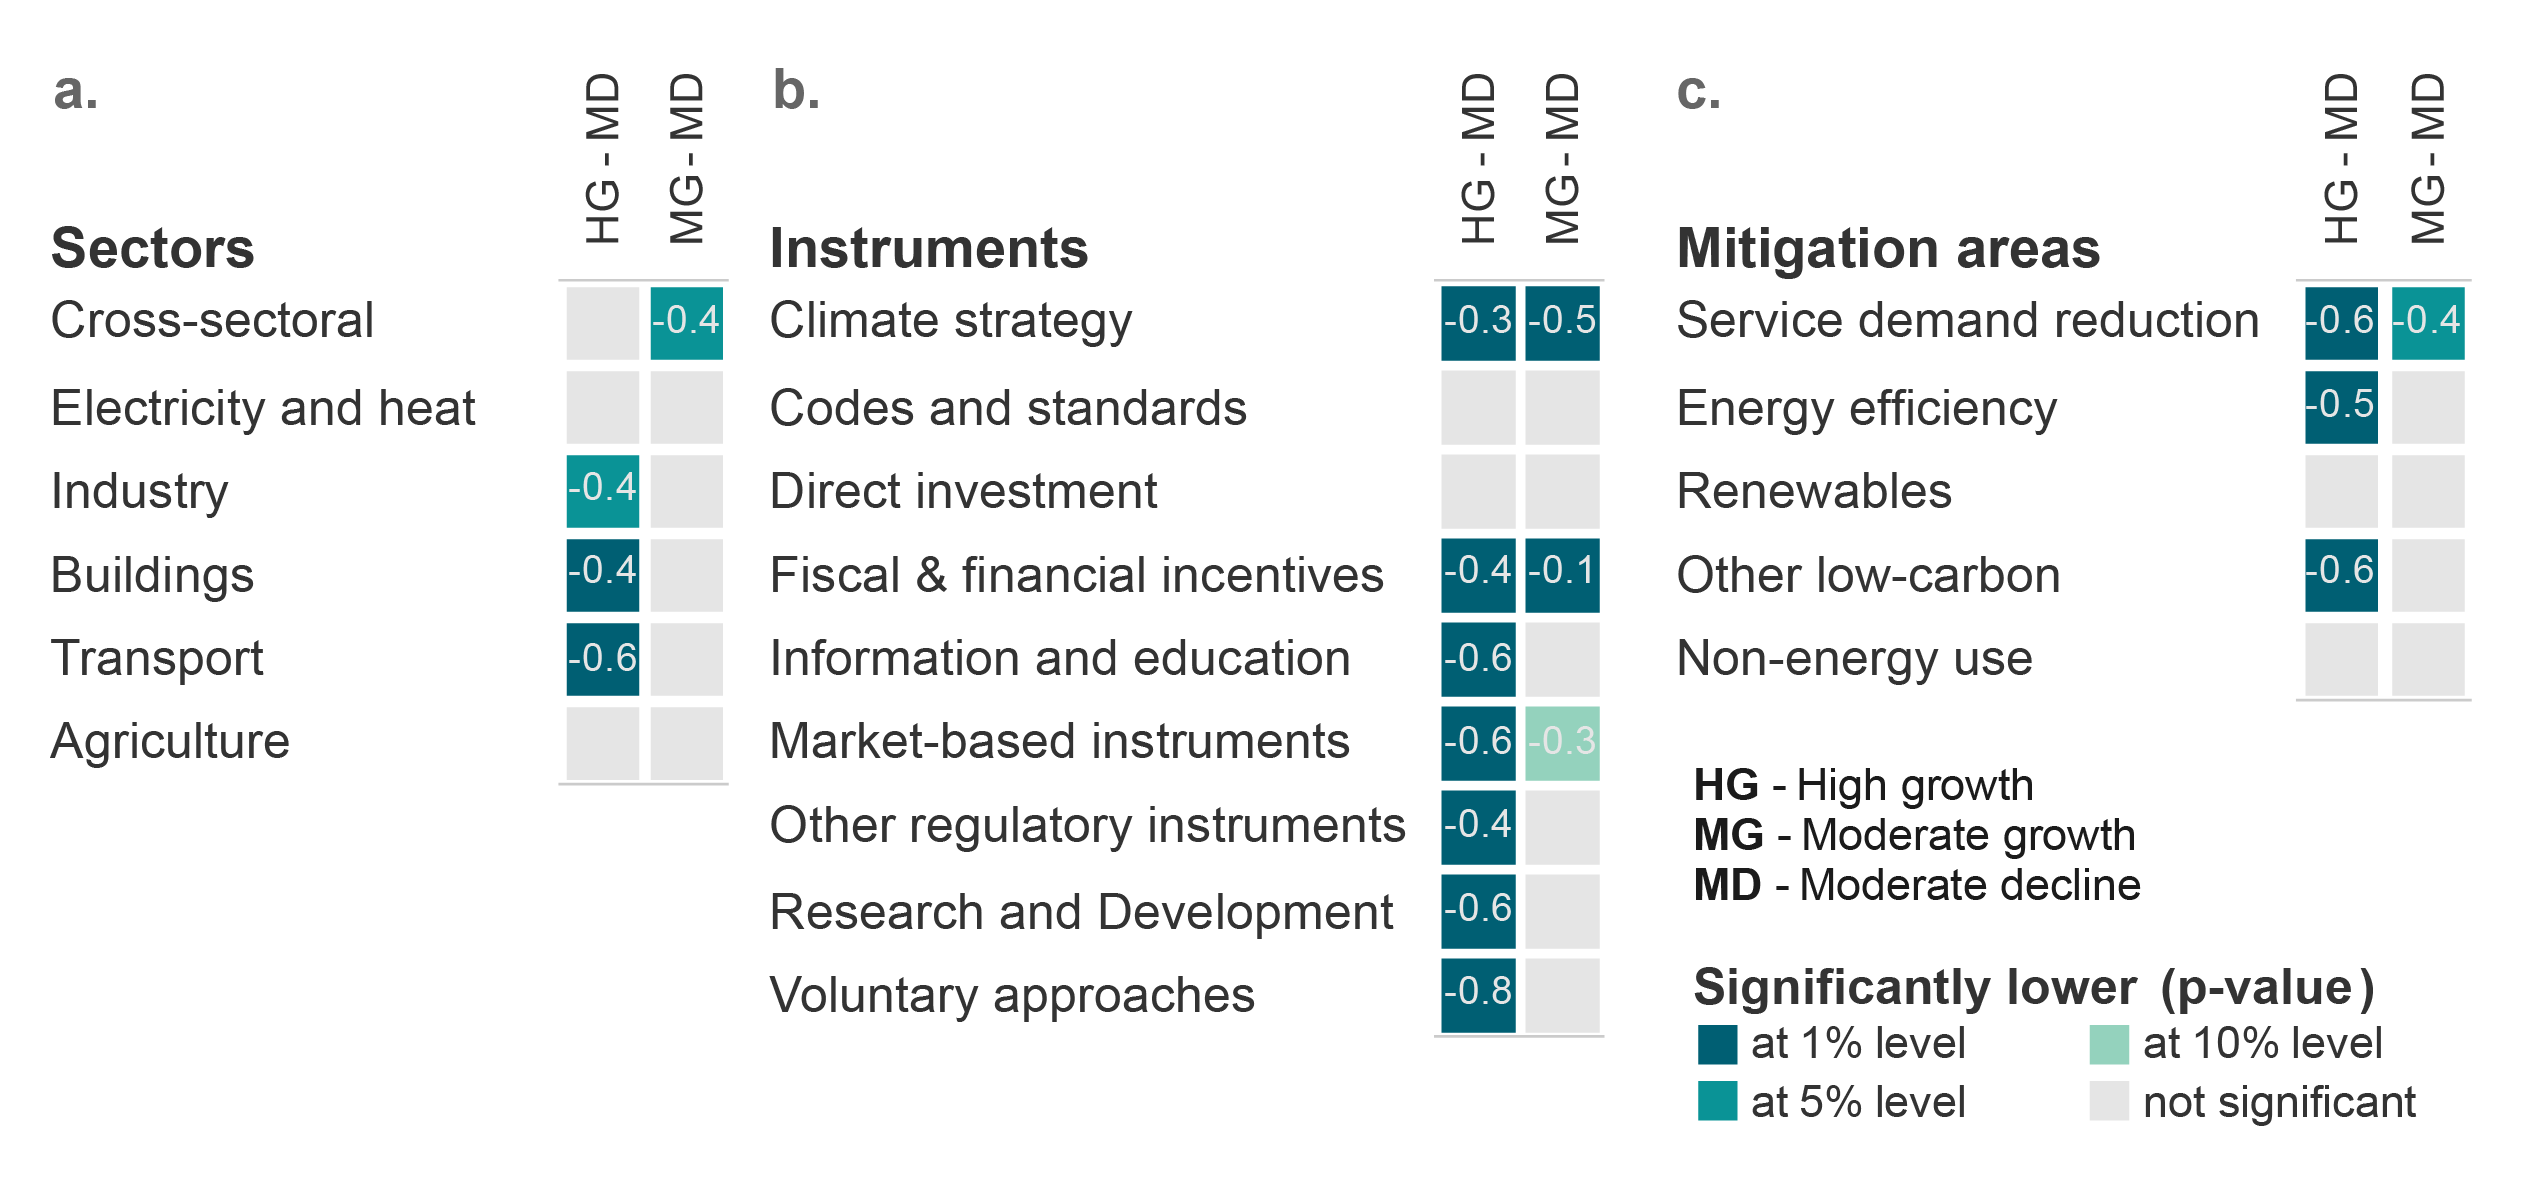
Figure 2: Comparing policy density to moderate decline cluster. Results from Mann–Whitney U one-tailed test comparing policy density across sectors (a), policy instrument types (b) and mitigation areas (c). Colours indicate whether policy density is significantly lower when compared to the ‘moderate decline’ cluster. Labels present the percentage difference of the medians. For example, the median number of climate strategies in the ‘high growth’ and ‘moderate growth’ clusters are respectively, 30% and 50% lower compared to the ‘moderate decline’ cluster.
Country clusters have distinct entry points to expand climate policy. Countries with fast-increasing emissions have significantly fewer policies overall but policies are especially missing in energy-demand sectors, such as buildings and transport. Countries with stalling emissions lack climate strategies and other cross-sectoral policies. This suggests the need for better coordination of mitigation efforts across sectors. In all country groups that fail to reduce emissions, policies to reduce energy and material demand are also substantially fewer.