A growing number of subnational and corporate actors set net-zero emissions targets. These include some of the world’s largest companies, and hundreds of cities and regions around the world. This paper provides a summary of the momentum of target setting among these subnational and corporate actors.
Main Findings:
The shift towards net-zero greenhouse gas emission pathways is accelerating. An increasing number of subnational and corporate actors are setting net-zero emission targets. These encompass:
- 823 cities and 101 regions, which represent more than 828 million people across every continent and close to 11 percent of the global population. Combined, these actors have an emissions footprint of more than 6.5 gigatonnes of GHG emissions, more than emissions from the U.S. in 2018.
- 1,541 companies with a combined revenue of over $11.4 trillion, equivalent to more than half of the US GDP, and covering 3.5 gigatonnes in GHG emissions.
These actors have committed to either fully decarbonising their emissions footprints or adopting specific net-zero targets in sectors like energy, transport or buildings. However, the ambition and potential impact of these targets vary widely. Some actors cover only scope 1 emissions, whereas others include the full range of scope 1, 2 and 3 emissions. Further, while direct and comprehensive reductions of an actor’s own emissions is the most unambiguous approach for achieving net-zero, actors plan to achieve net-zero emissions through various approaches, including purchasing RECs and carbon offset credits. The robustness of carbon offsets and the concept of additionality are key to assessing net-zero targets. A forthcoming report in October 2020 will delve into these issues and evaluate the health of city, region and company net-zero commitments and how they can be successfully implemented.
Graphs:
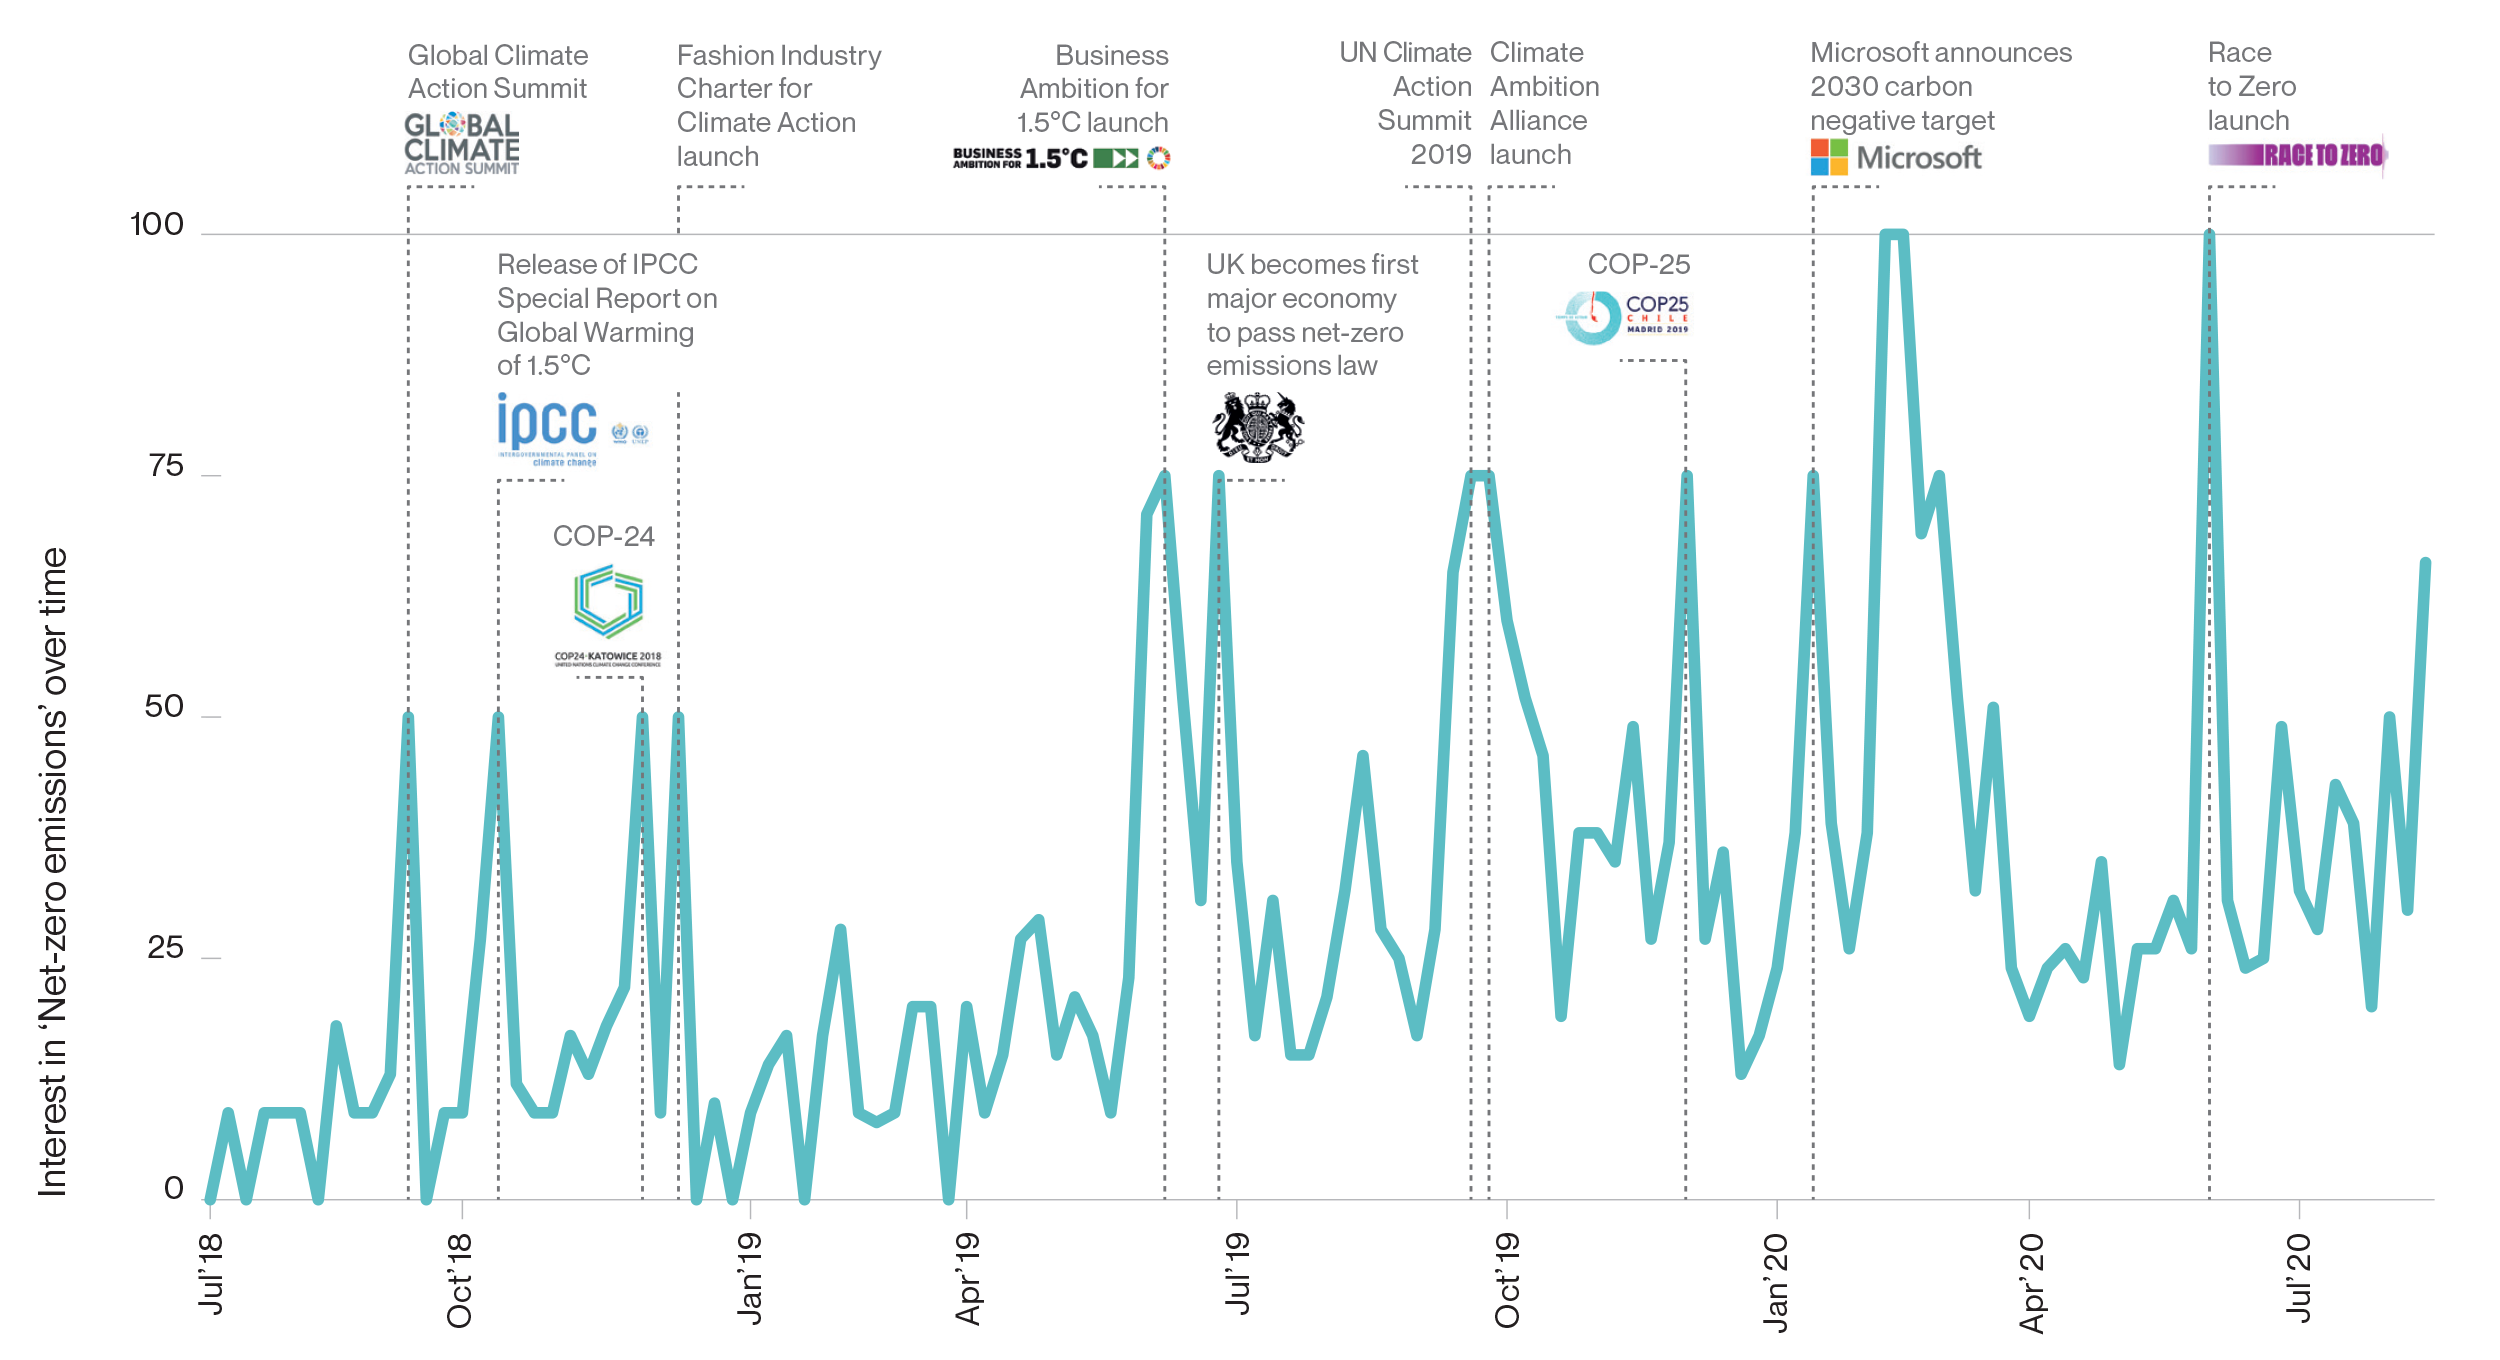 Figure1 . Peaks in the interest in “net-zero emissions” from Sept 2015 to August 2020 align with key climate-related events to galvanise climate ambition. Data source: Google Trends.
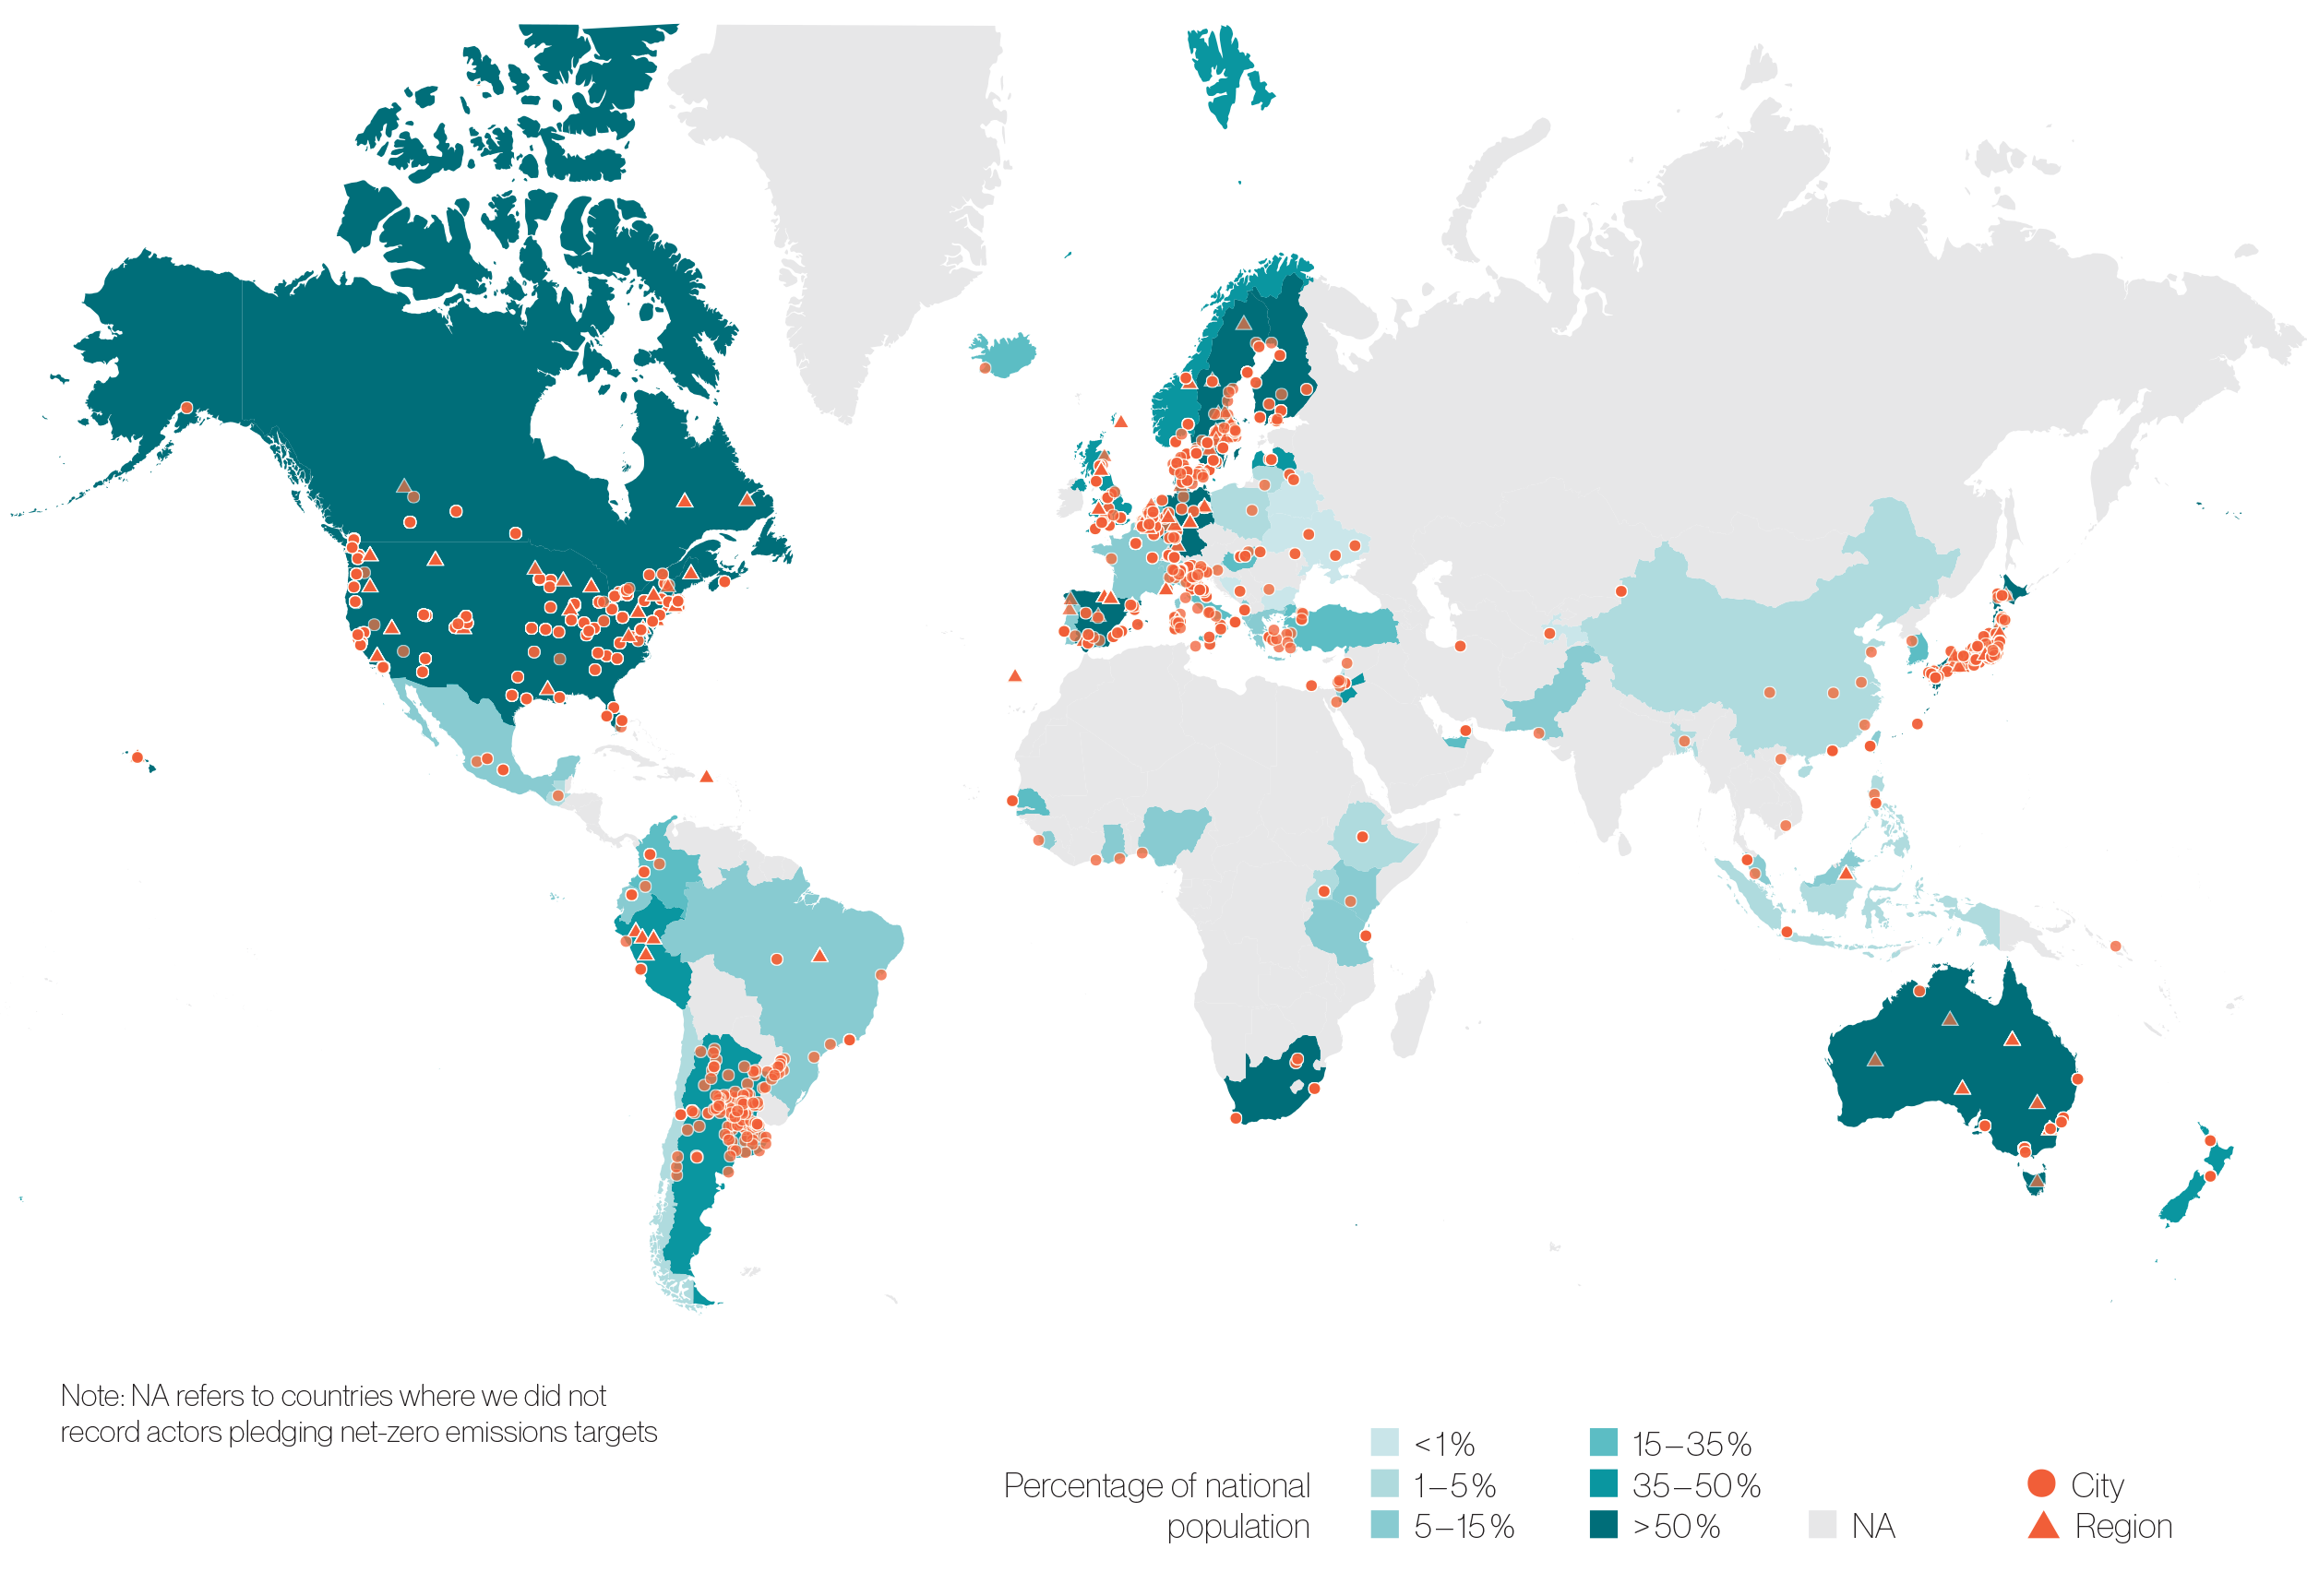 Figure 2. Map of cities and regions pledging some form of net-zero emissions target. Data source: Data-Driven EnviroLab (2020).
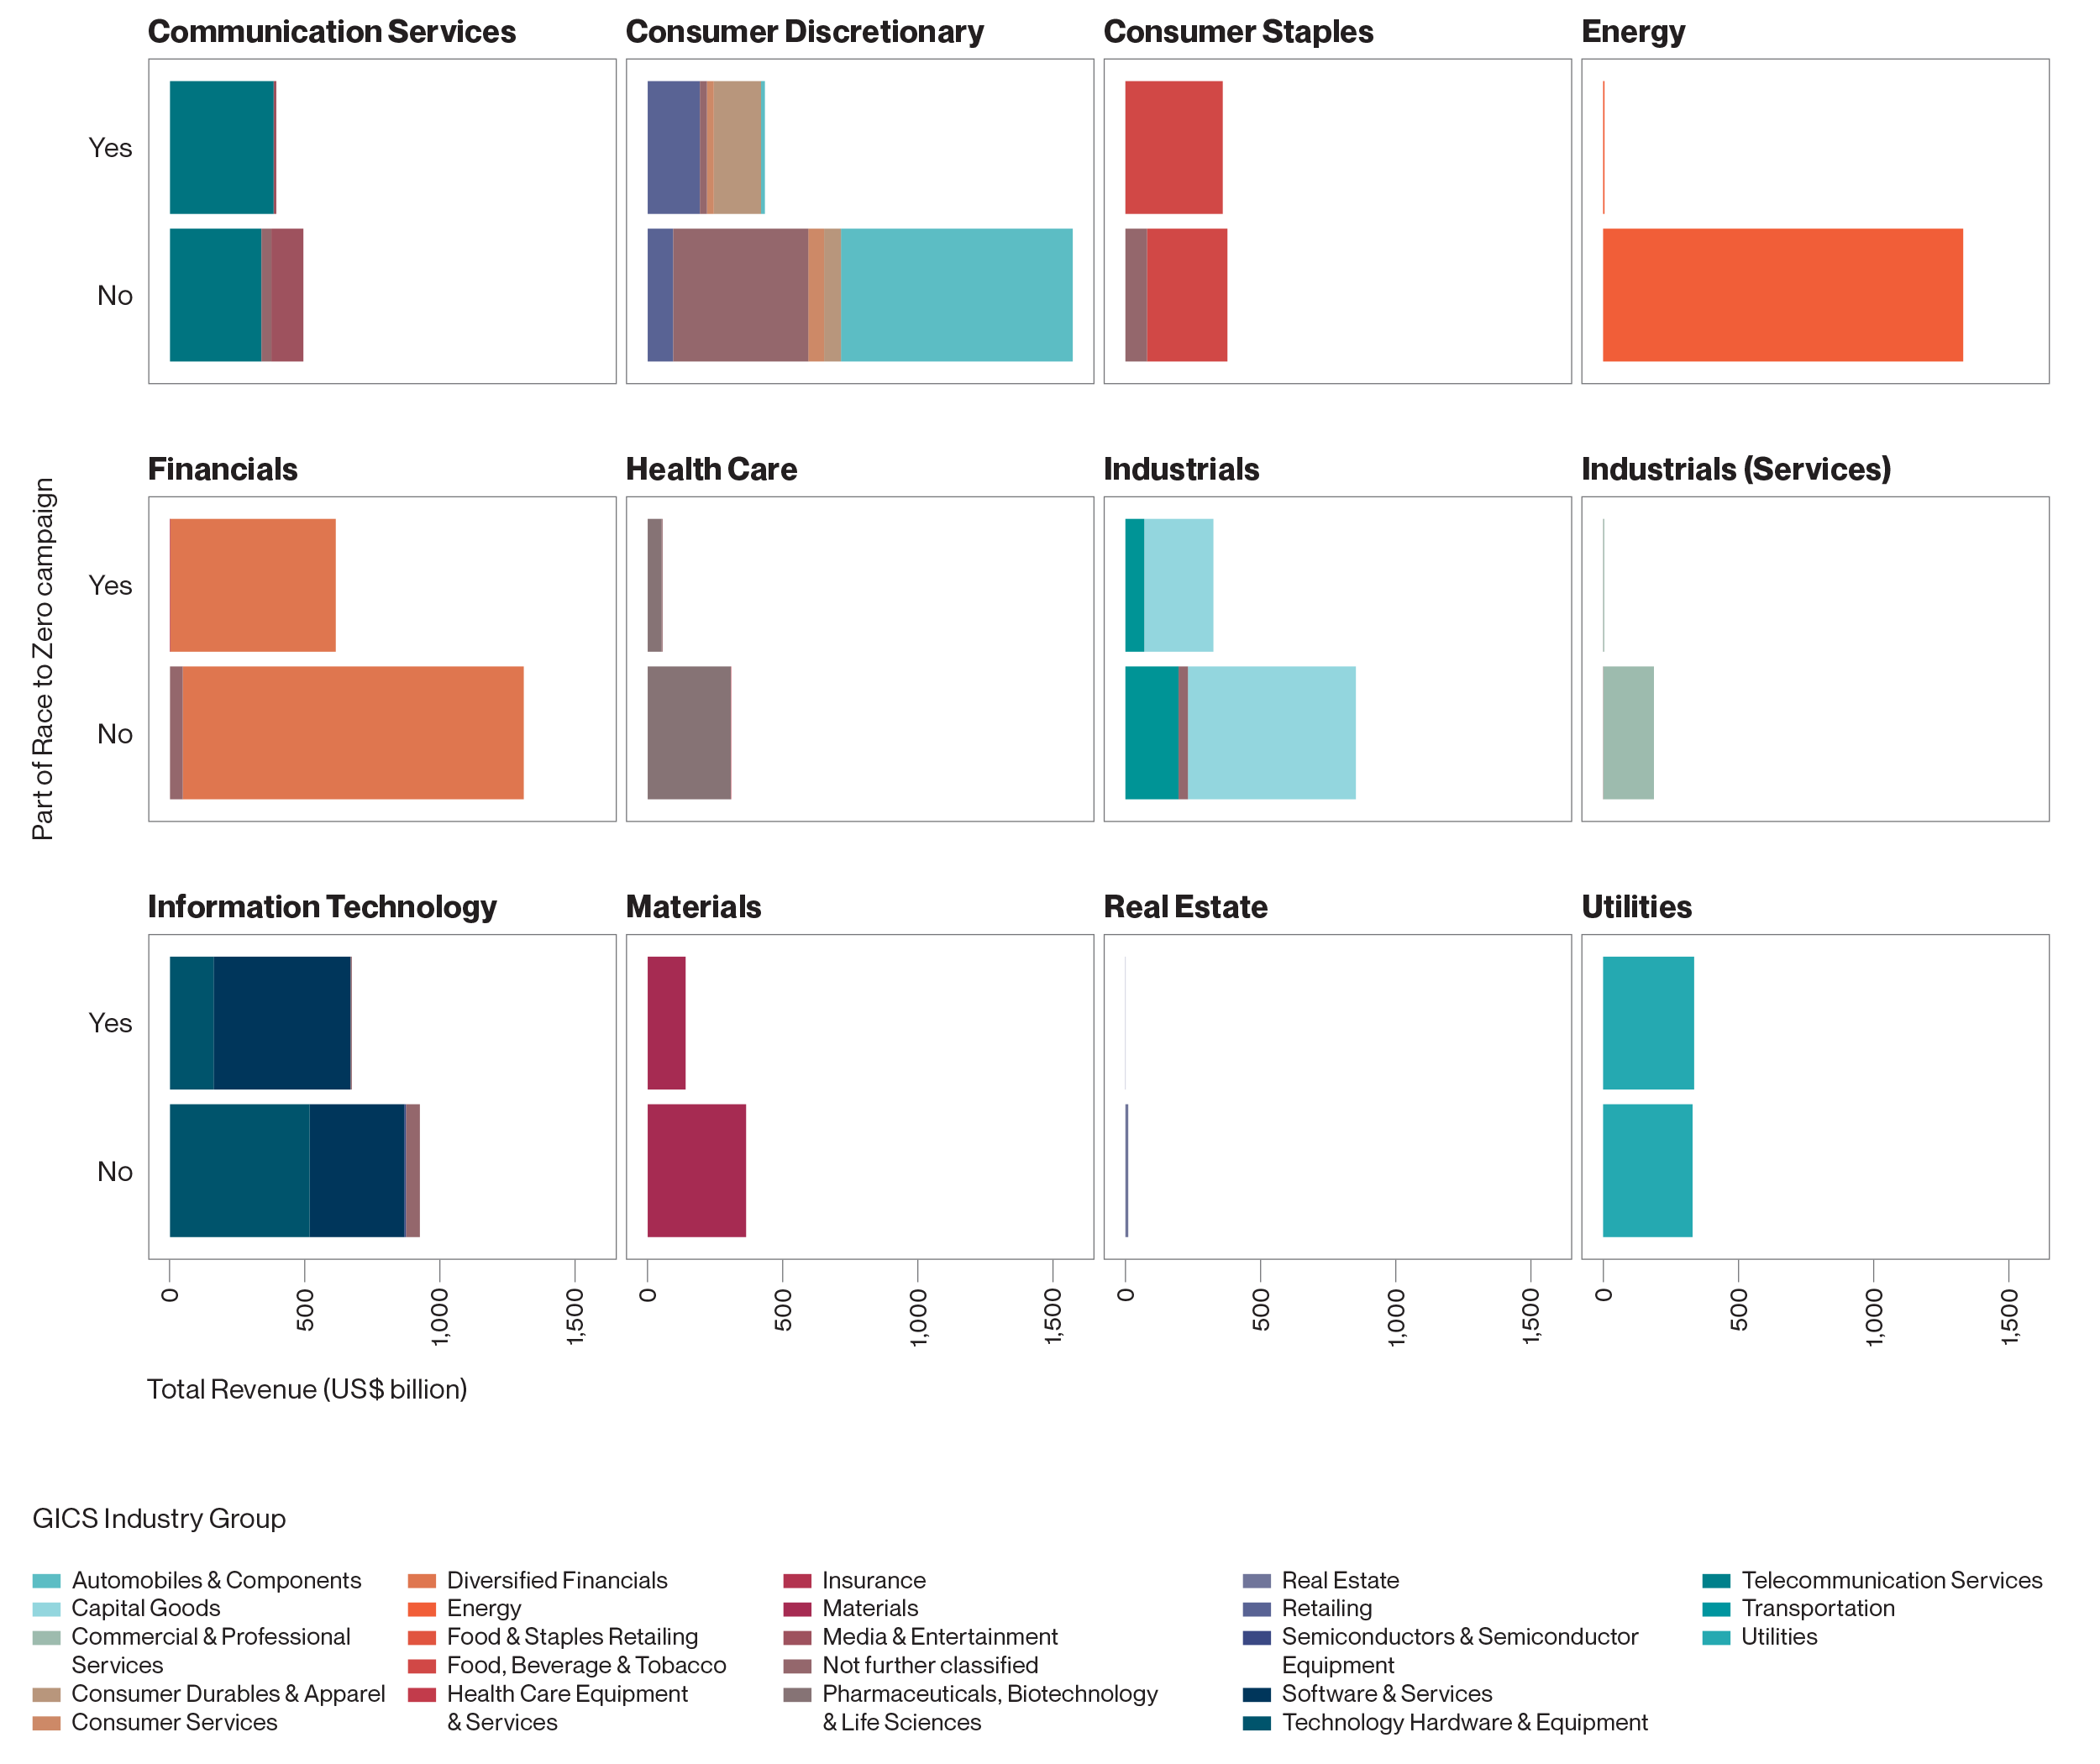 Figure 3. Revenue of actors pursuing net-zero emissions, according to their Global Industry Classification Standard (GICS) sector.
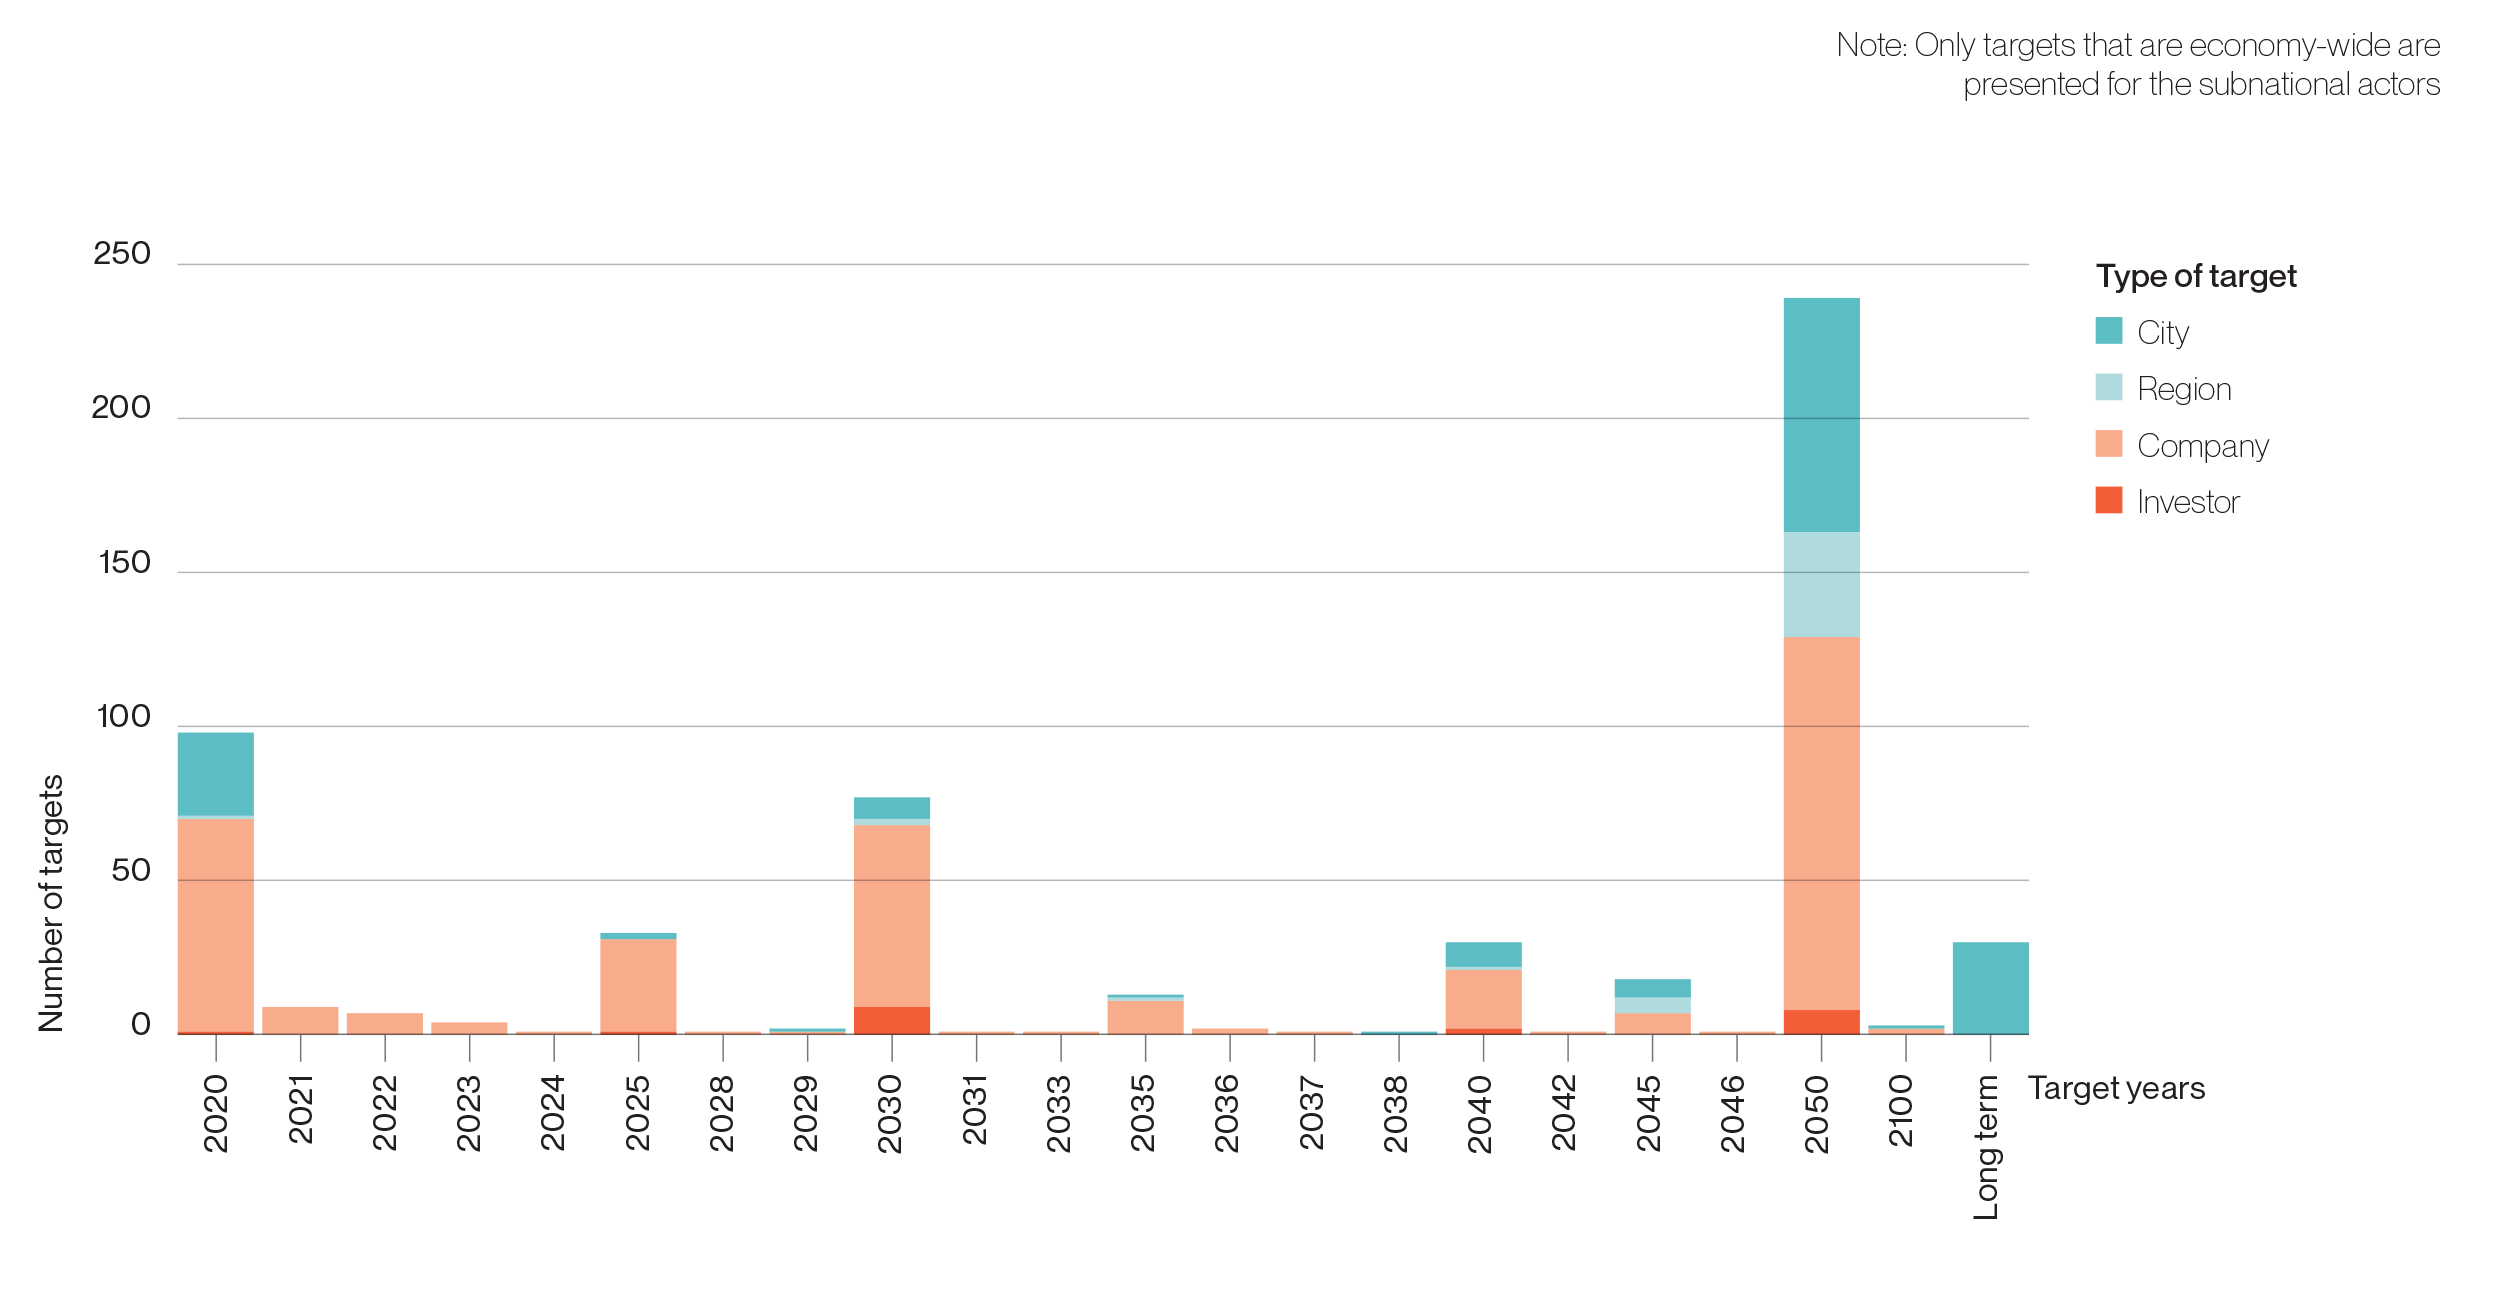 Figure 4. Net-zero target years for the different actor types (cities, regions, companies, investors).