The 2023 update report presents an overview of projected greenhouse gas (GHG) emissions up to 2030 based on existing climate and energy policies and compares them with the emissions implied by countries’ NDCs. We continually track countries’ progress towards their NDCs to improve accountability within the Paris Agreement framework.
Greenhouse gas emission levels based on currently adopted policies
Although official inventories are necessary to confirm historical emissions, our projections indicate that GHG emissions in the 25 countries as a group roughly plateaued or slightly increased over the past year between 2021 and 2022 (Section 2.1).
Full implementation of existing policies and actions results in 2030 emissions below 2019. Current policies result in 2030 emissions between -6% and +8% compared to 2019 levels (Table 1) – still falling short of the Paris Agreement's aligned 43% reduction.
| Comparison metric |
2022 report |
2023 report |
| 2025 aggregated emissions |
36.8 – 39.9 GtCO2e |
37.9 – 40.8 GtCO2e |
| 2030 aggregated emissions |
36.1 – 41.6 GtCO2e |
36.2 – 41.7 GtCO2e |
| Increase between 2015 and 2030 |
-4% – +11% |
-4% – +10% |
| Increase between 2019 and 2030 |
-5% – +9% |
-6% – +8% |
| Countries with 2030 emissions above 2015 |
16 |
15 |
| Countries with 2030 emissions above 2019 |
17 |
16 |
| Countries on track to meet the latest NDC target |
11 |
13 |
Table 1: Comparison of key metrics between 2022 and 2023 update reports. Data refers to aggregated emissions and count for the 25 countries analysed.
Aggregated key metrics remain relative stable since last year, but we quantify significant movements in individual countries (Chapter 3):
- United States: progress in the implementation of the Inflation Reduction Act substantially reduces projected emissions compared to our 2022 update report.
- European Union: continuous implementation of Fit for 55 policy and REpowerEU results in lower emissions in 2030 and could halve emissions between 2015 and 2030.
- United Kingdom: emissions projections are higher than we estimated in 2022 due to insufficient policy implementation. Emissions remain substantially below 2015, though some of the UK’s latest U-turn climate policies are not yet quantified.
- Indonesia: emissions are now higher than previously estimated due to an increase in the use of coal between 2021 and 2022 and a sizeable pipeline of coal-fired power plants for industry’s own production.
Progress towards NDC targets
All NDC updates since our last update report represent an improvement on previous versions through higher emissions reduction commitments. Seven countries have submitted new NDCs since our 2022 update: Brazil, Thailand, Viet Nam, Mexico, Türkiye, Egypt, the United Arab Emirates.
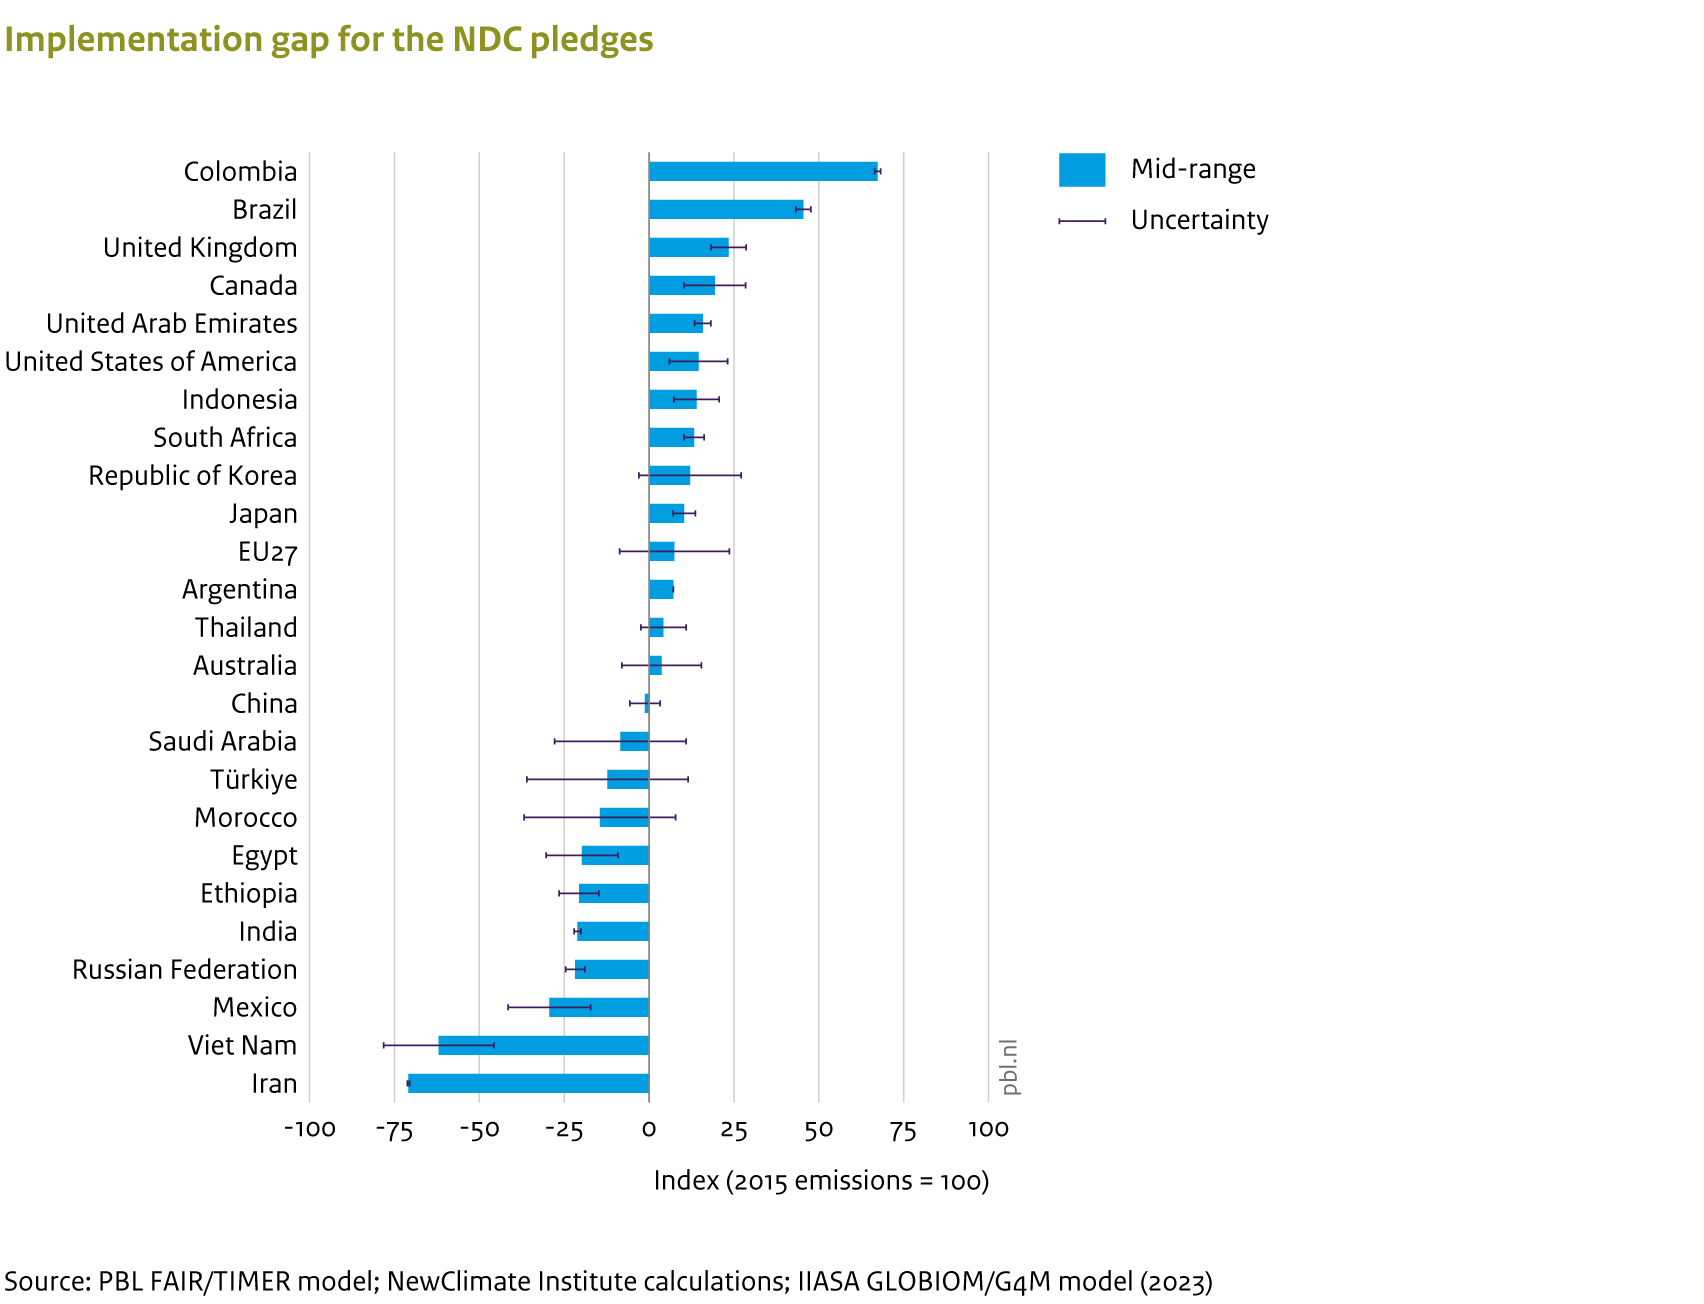
Figure 1: 2030 implementation gap between current policies and NDC targets in the 25 countries analysed. Countries with a negative implementation gap are on track to meet their NDC targets. The sectoral emissions coverage of scenarios for each country is aligned with the scope of the NDC. Source: produced by authors.
Eleven countries are clearly on track to meet their current NDCs targets and two additional countries are likely on track to meet their targets (Figure 1).
The countries on track to meet their targets are China, Egypt, Ethiopia, India, Iran, Mexico, Morocco, Russia, Saudi Arabia, Türkiye and Viet Nam.
Australia and the European Union (EU) are now likely on track to meet their targets. More specifically, the EU is projected to meet its NDC target based on the implementation of policies adopted at the EU level. Australia is projected to meet its target based on the implementation of national-level policies combined with more ambitious state-level policies.
The remaining twelve countries have an implementation gap (Figure 1); they need to adopt additional policies and follow up on the implementation of already adopted policies to meet their targets. The magnitude of the implementation gap indicates the level of additional effort necessary to meet the NDCs.