The updated results of NewClimate Institute’s research to track the preparation of INDCs are now published.
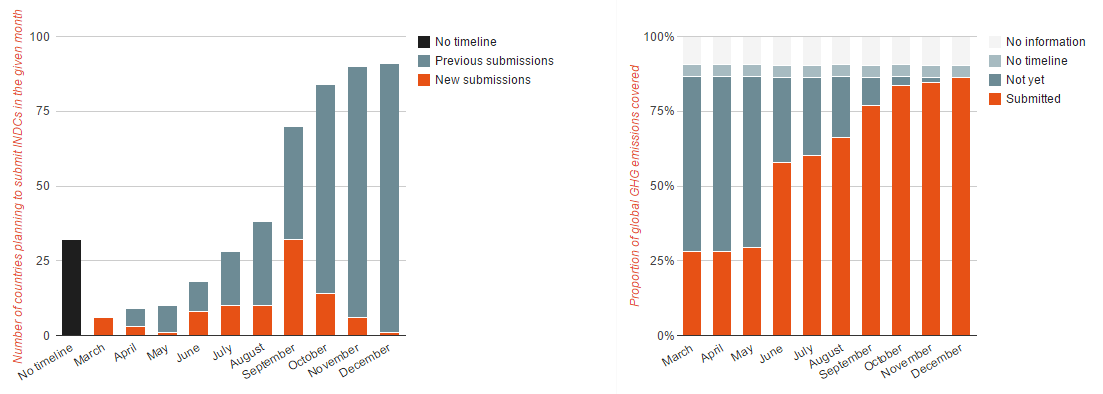
As delegates gather in Bonn for the UNFCCC climate change conference, a new wave of submissions of Intended Nationally Determined Contributions (INDCs) to the UNFCCC’s INDC portal are expected to be announced during the course of the two-week negotiations. By the end of June, approximately 58% of global GHG emissions are expected to be covered by submissions, as revealed in the latest update of research from NewClimate Institute.
All countries have been asked to present an emissions reduction proposal, which would ultimately be included in a new international climate agreement in December 2015. The Lima Call for Action encouraged countries “in a position to do so” to submit their INDCs by 31 March 2015. 5 submissions (including the EU with 28 member states) were received by that date, and by the end of May an additional 5 countries had made their official submissions. A second implicit submission deadline is 01 October 2015, after which submissions are still allowed but will not be included in the UNFCCC’s synthesis report, which will be made available to Parties in time for the 21st Conference of Parties in Paris, December 2015.
Research from NewClimate Institute for UNFCCC and UNDP has tracked the progress of INDC preparations worldwide, and collected insights and lessons learned from the various preparation approaches. A fourth update of the results was published on 31 May 2015 and includes information on the progress that 123 countries have made in the preparation of their INDCs.
Figure 1 shows that limited submission activity took place in the past 2 months, following the initial wave of submissions in March. However, as the graphic shows, the momentum is set to increase as a new wave of submissions is expected for June, followed by sustained submission activity in July and August, and another large wave of submissions in September. Coverage of global GHG emissions will reach over three quarters by the end of September.

Figure 1: Timeline showing the accumulated number of INDC submissions in each month and the proportion of global emissions covered.
The full results, aggregated at the global and regional level, are available to browse.


